

![]()
The Rugby World Cup is a different animal to the tournaments in between. It is the culmination of a four year building cycle for teams and lifelong dreams for the players who get to participate in it. Long before the event starts, anticipation for it begins building. In the year of the World Cup, all other tournaments take a backseat, their importance diminished by the ultimate showpiece which epitomises true success that year. In its modern form it is seven weeks of gruelling competition, where one slip is likely to derail your whole campaign. By now, everyone knows that no team who has ever won a World Cup has lost any matches during the pool stages. Players who have been in those situations often say that the pressure of World Cup rugby is the most they have experienced in their playing careers.
So, what does this pressure translate to on the field? Does it result in more mistakes being made, restricting teams from carrying out their intended game plan effectively? Or do coaches account for this by changing their team’s approach towards a more low risk style of play? Taking this line of questioning further, is there then a style of play that is most effective at World Cups and is it different from styles employed outside World Cups? In answer, this post seeks to determine whether it is possible to identify a pattern in the style of play[1] between World Cup winning teams which may produce a “World Cup Winning Template”.
For the question asking whether more mistakes are made during a World Cup than outside of it, I won’t be able to help you-that’s difficult data to get. But by using the basic match data provided by the nice guys at ESPN Scrum’s Statsguru, we are able to get at least a glimpse at the style of play teams employ to achieve victory in World Cup matches.
By looking at the stats for points scored, points conceded, the number of tries scored, number of conversions scored, number of penalties scored and number of drop goals scored each match, we are able to form a picture of which styles tend to produce winning results at World Cups: is it the gung-ho approach which emphasizes attack to score as many tries as possible, is it a dominating defence which forces opponents to take risks and capitalize on their mistakes through penalties, or is it something in between? Using the provided statistics, we are therefore able to compare,
1: Whether teams play differently before a World Cup than they do during it, and if so,
2: Whether the style of play employed by teams has changed over the course of historic Word Cups in pursuit of a World Cup winning template.
I removed any extreme mismatches by only including teams from the top tier annual tournaments, namely the Six Nations and the Rugby Championship (and resisted the urge to remove Italy after that). The analysis therefore only considers matches between the “The Big 10” – Argentina, Australia, England, France, Ireland, Italy, New Zealand, Scotland, South Africa, and Wales.
Style of play: Pre-World Cup vs During World Cup
By comparing the style of play employed by winning teams in the four years leading up to a World Cup (labelled as “Big 10 Inter WC”) to that during a World Cup tournament (“Big 10 WC”), we are able to determine if victory at a World Cup depends on a different style of play than victory outside of it.
When looking at graphs 1-4 below, it is apparent that the average number of tries scored by winning teams in matches between the Big 10 prior to World Cups has been increasing from about 1.5 per match in 1987 to 4 per match in 2019. The average number of tries scored by winning teams at World Cup tournaments however deviates from this trend: from 1999 to 2011 it has been declining, with only the 2015 tournament showing an improved average of one extra try per match from the 2011 tournament. Tellingly, is that the margins of inter World Cup periods and Worlds Cups has shown a reversing trend at an average of 2.5 more tries being scored in the World Cup than before it in 1987, to a swing of an 1 try per match less being scored in 2011 during World Cups, and 0.25 less in 2015.
Interesting to note is the massive jump of a try per match more being scored in the build up to the 2019 World Cup than to the 2015 World Cup. At the same time the number of penalties scored by winning teams for 2019 has shown a corresponding decline, something almost certainly attributable to teams becoming more aggressive in their styles of play by declining to take penalties and opting to score tries instead.
In general however, the average number of penalties scored by winning teams in between World Cups shows a slight decline from 1999 to 2015 while the average number of penalties scored during World Cups have shown a slightly steeper decline up to 2011, after which it increased by an average of one penalty per match for the 2015 World Cup compared to the period before the World Cup.


As can be expected, the average number of successful drop kicks per winning team at World Cups has been significantly more than Inter World Cups since the 1995 during World Cup tournaments and onwards. Since 2003 however, this average has dropped from about 0.7 per match to 0.25, while showing the same decline for inter world cup periods since 2007.

The average number of points scored per match by the winning team before and during World Cups closely reflect that of tries and doesn’t draw much interest.
The average number of points conceded by winning teams again show more interesting differences between the inter World Cup periods and the World Cups themselves. Similar to the average number of tries scored, Inter World Cup periods show a general increase in points conceded from 1987 to 2003, where it stayed even until 2019 when we saw another increase consistent with that seen in the tries and points scored stats. During World Cups however, points conceded declined sharply from 1995 to 2011 and showed a marked difference to the Inter World Cup years at its peak. On average about 7 less points were scored per match during the 2007 World Cup than the four years prior to it, while an average of 6 less points were scored at the 2011 World Cup.


The differences between inter World Cup and World Cup stats highlighted above show that between the Big 10 teams, victory at World Cup requires them to change their approaches to that which might achieve victory during inter World Cup periods. Had the World Cup trends mirrored those of the inter World Cup periods, it would have indicated general progression of the game due to rule change or player developments which is causing changes in the game and not due to the effects of the World Cup. But the general differences seen in stats between inter World Cup periods and World Cups, which as a pair are subjected to the same factors such as rule changes, shows that, in general, World Cups do indeed require a different style of play for teams to be successful.
The World Cup Winning Template
Now that we can see that the style of play required to achieve success at World Cups is different to that outside of World Cups, what sets the winners of a World Cup apart from the rest of the Big 10 teams[2] during the tournament?


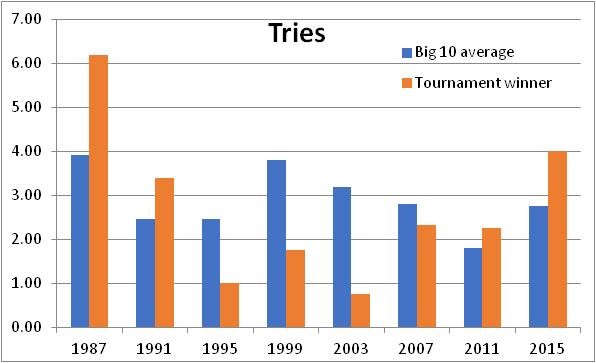

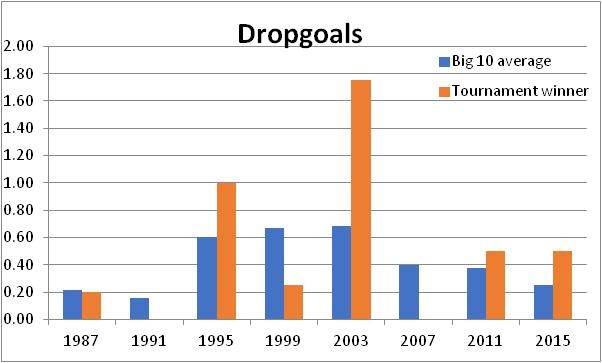
Past results show a low-risk approach to World Cup matches has been what set the tournament winners apart: Up to 2007 the winning teams’ defence was much better than that of the tournament average. In fact, from 1995 to 2007 defence was prioritized to such a degree that the tournament winning team scored less tries than the tournament average- essentially, against the other teams they were playing against. Along with the prioritisation of defence and de-emphasis on scoring tries, tournament winners would instead utilize penalties and drop goals as their tactical tools of choice to win matches. Penalties, in particular, were more regularly employed by tournament winners from 1999 to 2011 compared to the tournament average.
The World Cup of 2015, and to a lesser extent 2011, saw New Zealand alter the defence and penalty centric style of play that decided tournament winners in the decades before. Defence remained a crucial element to their success, at least in that they kept it on par with tournament average. However on the other side of the equation they increased their firepower. Instead of following the past trend of using penalties to score their points, they were now turning down penalties and opting to go for tries instead, which they did successfully. At the same time, they resorted to using drop goals when necessary.
The shift in the style of play brought about by New Zealand in 2015 could possibly lead to a change in the style of play employed by other teams. New Zealand showed that it was possible to have a defence on par with the tournament average, but improve their try scoring capabilities, while other teams stuck to the old template of choosing penalties over possible tries.
It will be interesting to note whether teams have adjusted their styles this tournament around to attempt to match the successful blueprint set by New Zealand. From the 1995 to the 2007 World Cup, spanning a period of 12 years, teams saw these stats and decided that they will just have to get better at the low risk approach, because to them that was the only way to win World Cups. All it took was for Henry and Hansen to buck the trend and develop a new approach with the tools at his disposal. By ensuring that their defence was at least as good as everyone else’s, they made sure that their try scoring proficiency was the best.
In conclusion, I would say that these World Cup Winning Templates exist only for as long as teams conform to a particular style. Now that the low risk-penalty centric approach has been proven ineffective, teams are likely to place a bigger focus on scoring tries over penalties. Yet it does not mean they will start playing a sevens style of rugby, I don’t have the stats for this but I am fairly confident (and I heard Victor Matfield say the same thing recently) that New Zealand scores most of their tries from loose or turnover ball – essentially by attacking when their opponents are most vulnerable.
New Zealand has proven that these styles of play can be dynamic – what is effective at one stage is unlikely to stay effective for long once counter measures have been developed for it. In that sense, styles can turn into the proverbial arms-race, coaches and teams continually have to try to improve on their approaches by devising measures and counter measures to win matches.
In the end, the game would never progress, or indeed prove interesting, without these.
[1] I am aware that using these four very basic metrics to define style of play requires a quantum leap in logic, but due to a lack of more accessible match data, allow me some room for sensationalism.
[2] Only 4 of the Big 10 teams have ever won World Cups, but we need the others to add some bulk to the data.
Willem Malherbe
Follow Willem on Twitter: @wfredm


